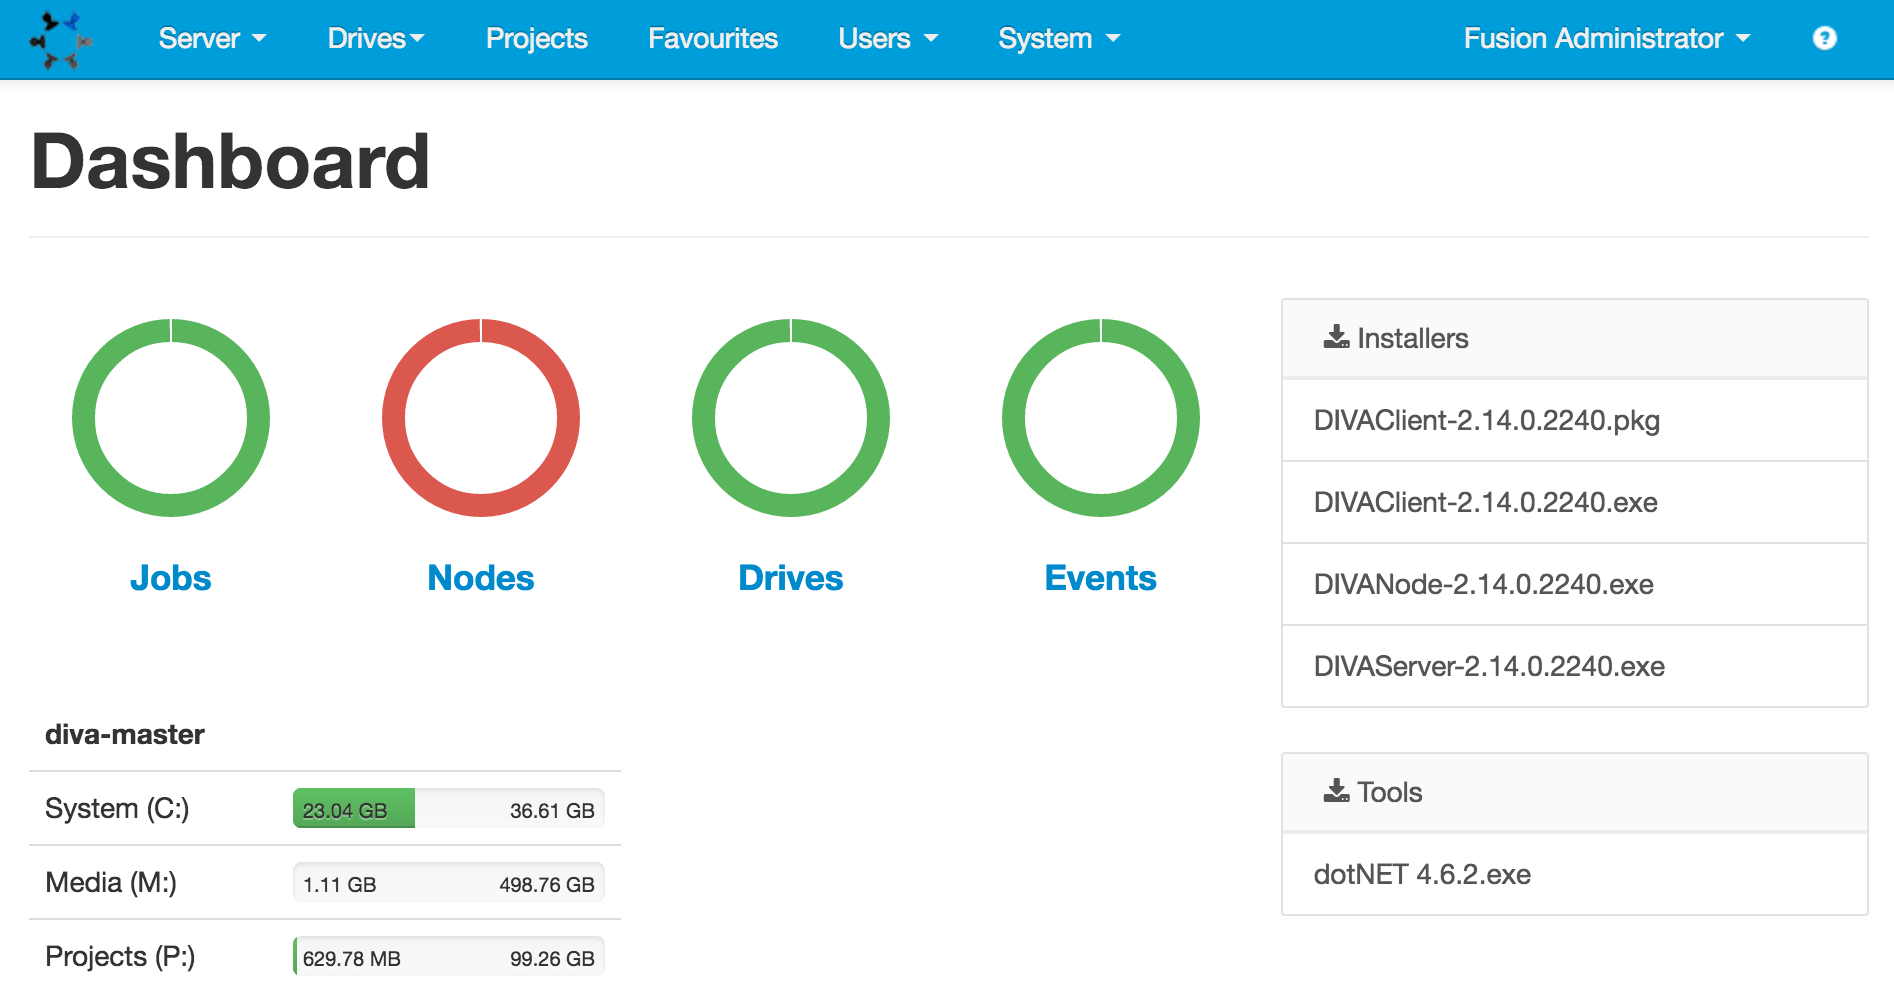
Status Graphs
The four circular graphs show the current status for Jobs, Nodes, Drives, and Events. Hovering over any graph will display a breakdown of what it represents, e.g. the number of jobs queued, failed, or completed. Clicking the graph title will take you to that management page within Fusion.
Installers
Download links for the various applications for your current version of DIVA.
Tools
Additional files which you want to make easily available to all users. These are stored in C:\Program Files (x86)\Group 6 Technologies\DIVA Fusion\Installs\Tools, and you can add any file to this folder.
Volume Usage
Any DIVA Volume which is monitored will display it’s usage statistics here. This is a quick method to gauge free space across multiple DIVA nodes.
You can change which volumes appear on the dashboard by changing each volume’s monitoring settings.